Ascending and Descending Wedges
Falling and Rising Wedges
Wedges are patterns that begin wide in which prices contract as they move higher or lower. The resulting shape is a cone with a lower line that slopes up as highs converge for a rising wedge and the upper line that slopes down as lows converge on a falling wedge. Rising wedges are bearish and falling wedges are bullish. This is confirmed by as support or resistance breakout, which is represented by the horizontal line formed by the price convergence.
Below are two examples of descending and ascending wedges.
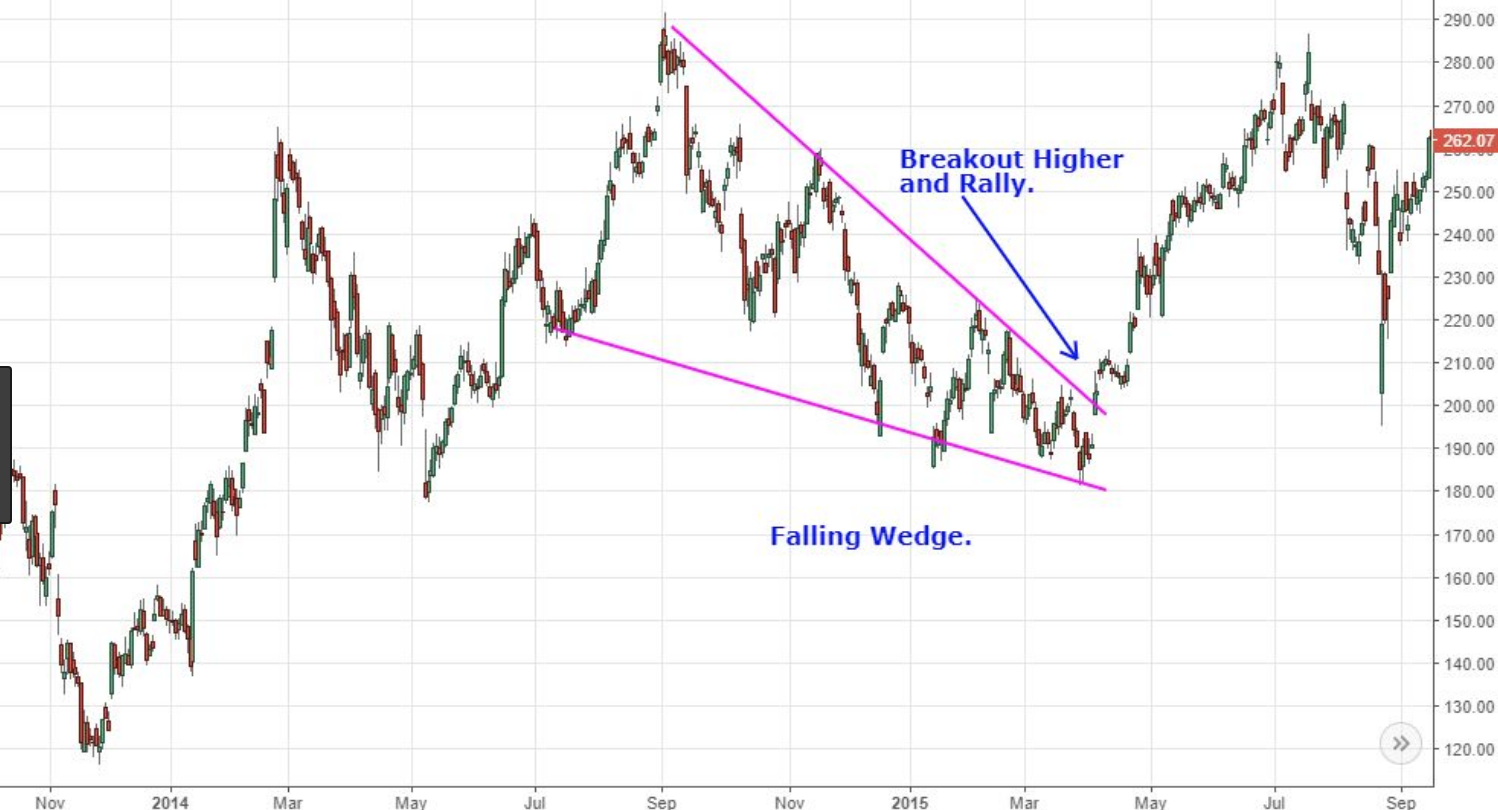
Falling wedges will form after a continued downtrend, and prices will tend to reject at the same level, forming the horizontal boundary of the wedge, which will be the holding support. The falling slope of resistance has to be broken to confirm the change in trend.
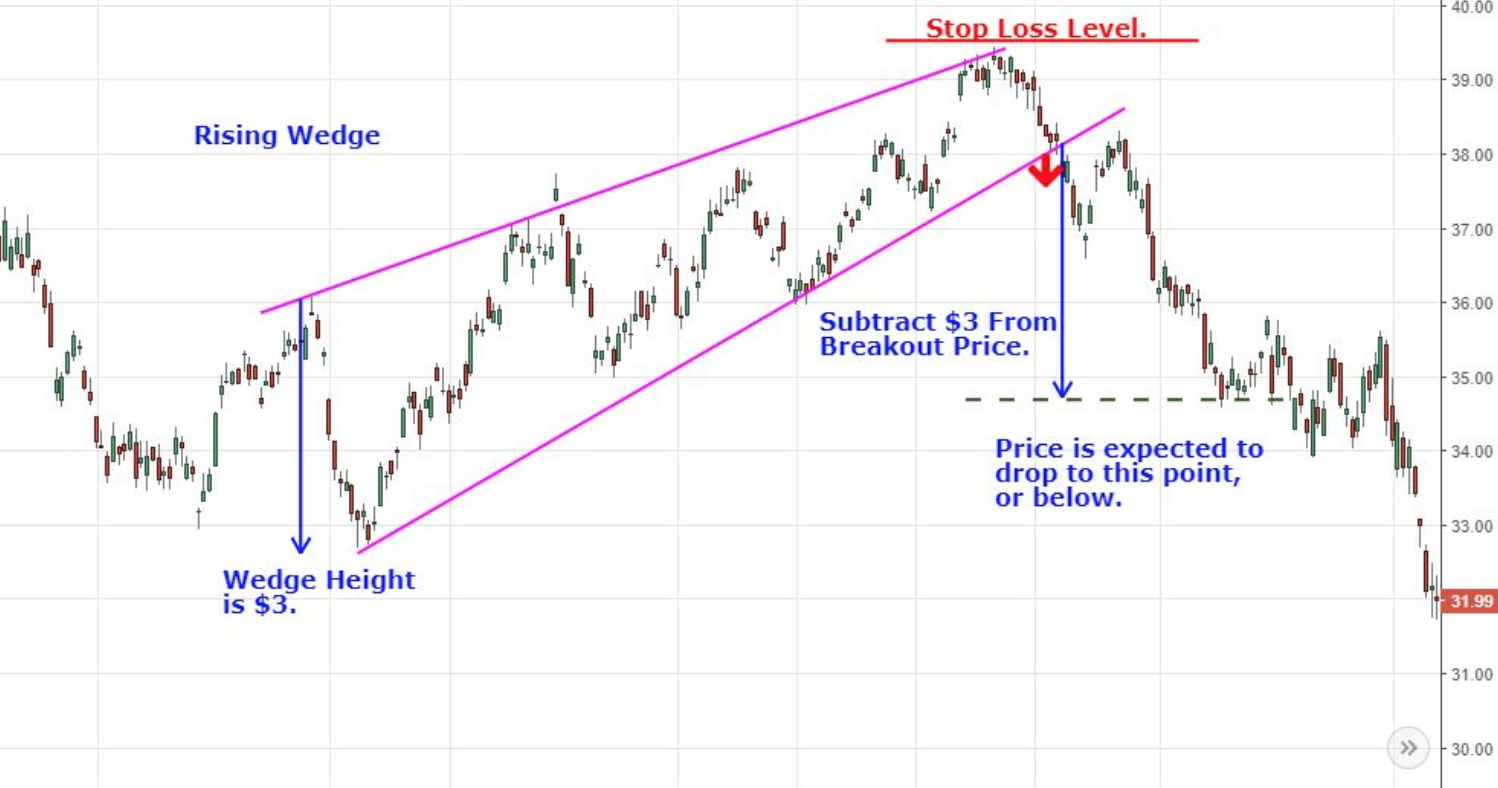
Rising wedge will form after a continued uptrend, where you can see that prices stall at the horizontal level, indicating that the power of the bullish sentiment is fading away. This horizontal level, indicating that the power of the bullish sentiment is fading away. This horizontal level will act as resistance that holds, and the slope acting as support has to be broke to confirm a change in trend. In both cases, one should wait for the break to be retested through a correction move to confirm that either the support has become a new resistance or the resistance has become a new support. Volume is more important in confirming the break of a falling wedge.
Both falling and rising wedges are consolidation patterns where either side of the market, depending on the scenario, is losing strength and momentum. The failure to cross the boundary formed by the horizontal line is a signal that upside or downside momentum is losing its potential, when the support or resistance is broken, you can see the contrarian side of the market has won, and prices will cross up or move down against the prevailing trend.
From my experience trading this pattern once the trend has been broken you are likely to see a retest of where the pattern has broken out. So technically once you have seen a break you can use your horizontal line for entry as support to then confirm the downtrend. As you can see from the above example we broke the trend at 38$ and then retested back at 38$ before coming lower again. We can use this as our entry point knowing the breakout has occurred and the pattern is intact.